Table of Contents
What Is Return on Ad Spend (ROAS)?
Return on Ad Spend (ROAS) is a digital advertising metric that measures how much revenue a business generates for every unit of money spent on advertising. It helps marketers evaluate ad campaign performance and understand whether their paid media activities are generating measurable sales.
For example, if a company spends $1,000 on an advertising campaign and generates $4,000 in attributed revenue, its ROAS is 4:1. This means the campaign generates $4 in revenue for every $1 spent on ads.
ROAS is commonly used to evaluate campaigns on platforms such as Google Ads, Meta Ads, and other paid media channels. It can also help businesses compare advertising campaigns, audiences, keywords, and creative formats.
However, ROAS measures revenue relative to advertising costs, not actual profit. A campaign with high ROAS may still lose money if product costs, shipping, agency fees, or other expenses are too high.
Why ROAS Matters for Businesses
Tracking ROAS helps businesses:
- Measure advertising effectiveness.
- Compare paid media performance across campaigns.
- Identify profitable advertising channels.
- Allocate budgets based on performance.
- Evaluate changes to targeting, messaging, and creative content.
- Support marketing ROI analysis and budget planning.
When combined with profit margins, customer acquisition metrics, and reliable revenue attribution, ROAS provides a clearer picture of advertising performance.
How to Calculate Return on Ad Spend
Calculating ROAS requires two main figures: revenue attributed to advertising and the advertising cost responsible for generating that revenue.
The ROAS Formula
The basic formula is:
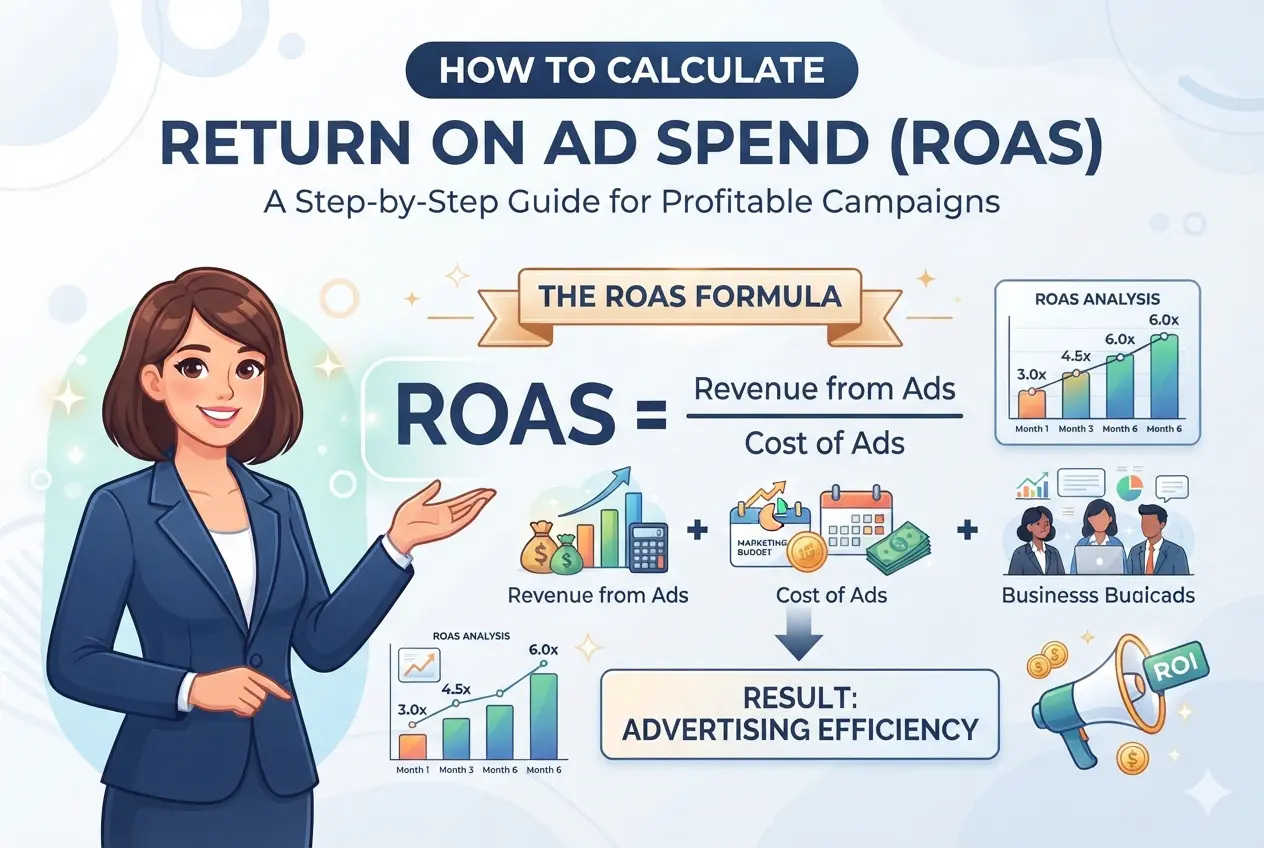
ROAS = Revenue Attributed to Advertising ÷ Advertising Spend
ROAS is usually expressed as a ratio, such as 3:1, or as a percentage, such as 300%.
To convert the ratio into a percentage:
ROAS (%) = (Attributed Revenue ÷ Advertising Spend) × 100
For example, a ROAS of 5:1 equals 500%. It means the campaign generated five dollars in attributed revenue for every dollar spent on ads.
Use revenue and advertising costs from the same campaign and measurement period. Define which sales count as advertising-driven conversions before comparing results.
Step-by-Step ROAS Calculation
Step 1: Determine advertising spend
Calculate the total amount spent on the campaign during the selected period. Depending on your reporting method, this may include only platform media spend or additional campaign-specific advertising expenses.
Step 2: Measure attributed revenue
Determine the revenue associated with the campaign using your advertising platform, analytics system, or sales records. Account for refunds, cancellations, and duplicate conversions where possible.
Step 3: Divide revenue by advertising spend
Use the ROAS formula to calculate the revenue generated per unit of advertising spend.
Step 4: Compare campaign results
Evaluate ROAS alongside conversion rate, cost per acquisition, average order value, and profit margin. This helps determine whether a campaign is efficient and financially sustainable.
Step 5: Review performance over time
Compare results across consistent periods and attribution settings. Consider seasonal demand, delayed conversions, and changes in the customer journey before increasing or reducing your advertising budget.
ROAS Calculation Example
Suppose an online store runs a paid advertising campaign with the following results:
| Metric | Value |
|---|---|
| Advertising spend | $2,000 |
| Attributed revenue | $8,000 |
| Orders generated | 100 |
| Average order value | $80 |
Using the formula:
ROAS = $8,000 ÷ $2,000 = 4:1
As a percentage:
ROAS = ($8,000 ÷ $2,000) × 100 = 400%
The campaign generated $4 in attributed revenue for every $1 spent on advertising.
However, the $6,000 difference between revenue and advertising spend is not necessarily profit. The business must still account for product costs, fulfillment, payment processing, returns, and other operating expenses.
If the store’s gross profit margin is 40%, its gross profit from the attributed revenue would be $3,200. After subtracting the $2,000 advertising spend, $1,200 remains before other expenses not already included in the gross margin.
This demonstrates why ROAS should be evaluated alongside campaign profitability rather than used as a standalone measure of success.
ROAS vs. Advertising ROI and Marketing ROI
ROAS and Advertising ROI are related but measure different aspects of performance.
ROAS measures attributed revenue relative to advertising spend. It focuses on the revenue generated by paid media.
Advertising ROI measures the financial return from advertising after considering relevant costs. A profit-based calculation can be expressed as:
Advertising ROI = (Advertising-Generated Profit − Advertising Cost) ÷ Advertising Cost × 100
Marketing ROI evaluates the return from broader marketing activities, potentially including advertising, content creation, marketing software, agency fees, and staff costs.
For example, a campaign may have a ROAS of 400%, but its actual return may be much lower after product costs and other expenses. Businesses should define their cost assumptions clearly when comparing these metrics.
What Is a Good ROAS?
There is no universal ROAS target for every business. The appropriate target depends on gross profit margins, operating expenses, customer lifetime value, average order value, and business objectives.
A low-margin retailer may need a higher ROAS to cover product and fulfillment costs. A subscription business may accept a lower initial ROAS if customers generate recurring revenue and remain profitable over time.
To establish a target:
- Calculate your gross profit margin.
- Identify the advertising and other costs that must be covered.
- Estimate the minimum ROAS required to avoid losing money.
- Set a target that supports your desired profitability.
- Validate the target using actual campaign results.
For a simplified break-even calculation, if gross profit margin is 40% and advertising is the only additional cost being considered, the break-even ROAS is 2.5:1. This is because each dollar of revenue generates $0.40 in gross profit, so $2.50 in revenue produces $1.00 in gross profit to cover $1.00 of ad spend.
In practice, additional variable expenses may require a higher break-even ROAS.
Factors That Affect ROAS
Several factors influence advertising performance.
Audience targeting: Reaching people who are more likely to purchase can increase conversion rates and reduce wasted spend.
Creative quality: Relevant images, videos, headlines, and offers can improve engagement and conversions.
Landing page experience: Slow pages, confusing navigation, and complicated checkout processes can reduce conversion rates.
Average order value: Relevant bundles and product recommendations may increase revenue per order.
Cost per acquisition (CPA): Higher acquisition costs can make campaigns less sustainable, even when revenue increases.
Revenue attribution: Different attribution windows and models can assign different amounts of revenue to the same campaign.
Customer lifetime value: Acquiring a customer may produce value through repeat purchases or recurring revenue that is not captured by the initial transaction.
How to Improve ROAS
Businesses can improve ROAS by making data-driven changes to their campaigns.
- Optimize targeting: Focus on relevant audiences and exclude segments that consistently generate poor results.
- Test ad creatives: Experiment with headlines, images, videos, and offers to identify stronger combinations.
- Improve landing pages: Make product benefits clear, improve loading speed, and simplify checkout.
- Monitor conversion rates: Use conversion rate optimization to remove obstacles in the purchase process.
- Review bidding and budgets: Adjust spending based on reliable performance data rather than short-term fluctuations.
- Increase average order value: Offer relevant bundles, complementary products, or free-shipping thresholds where financially appropriate.
- Track customer acquisition cost: Compare acquisition costs across campaigns and channels.
- Measure profitability: Consider product costs and fulfillment expenses instead of optimizing revenue alone.
Test one or a small number of changes at a time when possible. This makes it easier to understand which adjustments actually improve results.
Common ROAS Calculation Mistakes
Avoid these common errors:
- Treating revenue minus ad spend as net profit.
- Including all business revenue instead of revenue attributed to the campaign.
- Comparing campaigns with different attribution windows.
- Ignoring refunds, cancellations, or duplicate conversions.
- Excluding important campaign costs without documenting the decision.
- Increasing budgets based on a small sample of conversions.
- Ignoring repeat purchases or the long-term value of acquired customers.
Consistent measurement definitions make ROAS comparisons more useful and prevent misleading conclusions.
How a ROAS Calculator Helps
A Return on Ad Spend Calculator simplifies the calculation by allowing you to enter advertising spend and attributed revenue. It can instantly show ROAS as a ratio and percentage.
For example, entering $1,500 in ad spend and $6,000 in attributed revenue produces a ROAS of 4:1, or 400%.
Use the result alongside CPA, CAC, conversion rate, gross profit margin, and Marketing ROI to evaluate the wider impact of advertising. A calculator makes the arithmetic easier, but the quality of the result still depends on accurate revenue attribution and cost data.
Frequently Asked Questions
Is 300% ROAS good?
A 300% ROAS means the campaign generates $3 in attributed revenue per $1 spent on advertising. Whether that is good depends on profit margins, other costs, and the business’s financial goals.
What is the difference between ROAS and CPA?
ROAS measures revenue generated per unit of advertising spend. Cost per Acquisition (CPA) measures the average advertising cost required to generate a defined conversion, such as a purchase or lead.
Can ROAS be used for lead generation?
Yes, but lead generation campaigns need a reliable way to connect leads with eventual revenue. If revenue is not directly available, businesses can use qualified leads, conversion rates, and estimated customer value, while clearly identifying assumptions.
How often should ROAS be measured?
Review ROAS regularly, such as weekly or monthly, depending on campaign volume and sales cycles. Allow sufficient time for conversions to occur before making major decisions.